Note
Go to the end to download the full example code
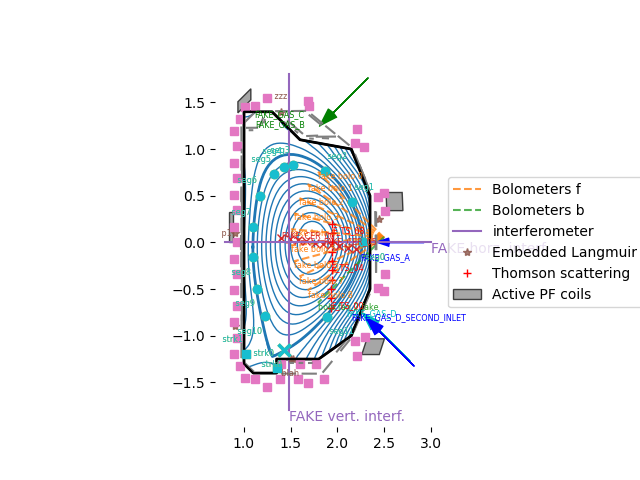
OMAS plot overlays
This example loads sample DIII-D overlay data and generates an overlays plots
from matplotlib.pyplot import show, gca
from omas import *
import numpy

# load sample data from S3
ods = ods_sample()

# plot equilibrium and wall
ods.plot_equilibrium_CX(contour_quantity='psi_norm')
# plot overlays
ods.plot_overlay(  # Values can be True to simply turn on or dict to pass keywords to specific overlay functions
    gas_injection={'colors': ['b', 'g', 'c']},  # , 'which_gas': ['GASA', 'LOB1']},
    bolometer={'labelevery': 1, 'linestyle': '--'},
    thomson_scattering={'labelevery': 4, 'color': 'r'},
    debug_all_plots=True,
)
gca().legend(loc='center left', bbox_to_anchor=(1, 0.5))
gca().set_aspect('equal')

# display figure
show()