GYRO verification and validation (pre 2010)
[This research summary was written in 2010]
Verification Studies
Cyclone Base Case with Adiabatic Electrons (2001)
A complete \(R/L_T\) scan for the Cyclone Base Case with adiabatic electron was published in [CW03a]. We reproduce below Fig. 11 from that publication:
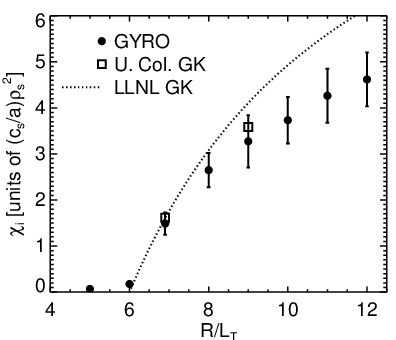
Figure 1: \(\chi_i\) versus \(R/L_T\) scan for the Cyclone Base Case, compared with results from the LLNL and Univ. of Colorado gyrokinetic PIC codes.
Local limit of Global Simulations (2004)
After the publication of this work, a community-wide benchmark exercise was carried out between codes with local capability (GYRO and GS2) and a global code (GTC). The difficulties encountered by the global code in attempting to reproduce the local limit in \(s-\alpha\) geometry was addressed in [CWD04], where it was demonstrated that the local limit can be achieved in a truly global simulation. We reproduce below Fig. 3 of that paper:
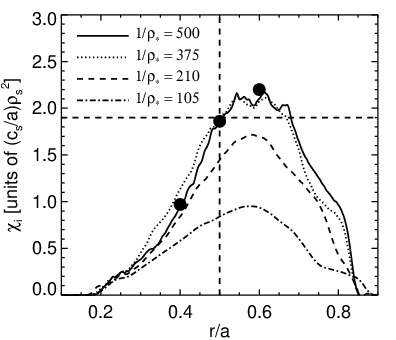
Figure 2: Curves show radial profile of \(\chi_i\) averaged over the time inteval \(400 \le (c_s/a) t \le 900\), as computed by GYRO. Solid dots show results of three separate GS2 flux-tube simulations.
Gyrokinetic Simulation of Impurities (2004)
Prior to 2004, basically all simulation work was done with pure plasmas. As part of a Ph.D. thesis (Estrada-Mila), a paper on the topic of transport in impure plasmas [EMCW05] was published. This work contained crucial benchmarks with the GS2 code. Figure 1 from that paper is reproduced below:
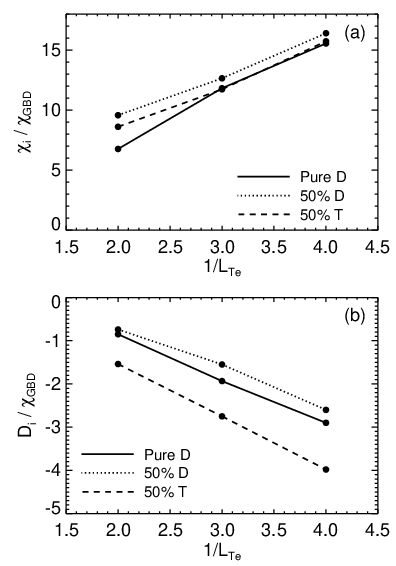
Figure 3: Adiabatic electron comparison of growth rates for the GYRO (solid line) and GS2 (black dot) codes. Also shown are published results by Dong [DH95] (dotted line) which neglect trapping. Plot (a) shows the growth rate as functions of \(k_\theta \rho_s\). Plot (b) shows the effect of carbon concentration, \(f_C = z_C n_C/n_e\), for \(k_\theta \rho_s = 1/\sqrt{2}\) and \(s=1\). All other parameters are the same in both plots. Agreement between GYRO and GS2 is extremely good.
Electron Temperature Gradient Turbulence (2006)
Motivated by incorrect published results from a global code, a large community-wide benchmark exercise was carried out including the most advanced European gyrokinetic code, GENE. The results were published in a paper [NCC+06] that clarified difficulties associated with simulations of ETG turbulence, and a new low-shear operating point was designed so that benchmark case was physically well-behaved. Remarkable intercode agreement was obtained
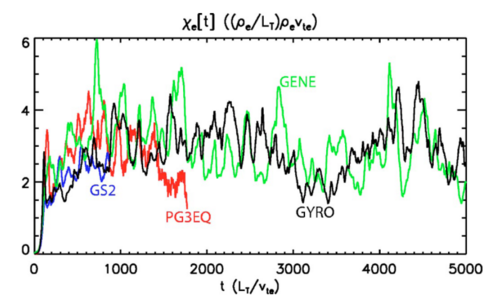
Figure 4: \(\chi_e = -Q_e/n_0 \nabla T_0\) from GYRO (black curve), GS2 (blue curve), GENE (green curve), and PG3EQ (red curve) are plotted versus time.
Later, the exercise was successfully achieved by the GEM code. The GTC group refused to participate.
Energetic particle transport coefficients (2009)
Following up on initial work by Estrada-Mila [EMCW06a], Angioni [APP+09] carried out detailed GS2-GYRO comparsions of alpha particle quasilinear transport coefficients. This comparison tests, among other things, the multi-scale accuracy of the gyro-averaging operators for electrons and ions. Below we reproduce Fig. 5 of that paper:
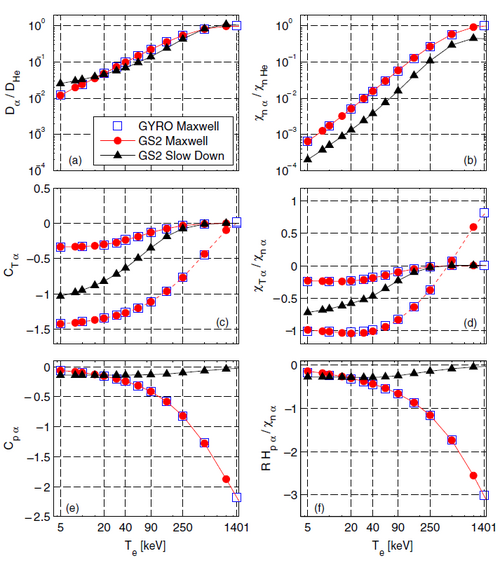
Figure 5: Diffusion, thermodiffusion and pure convection coefficients for \(\alpha\) particles in the case of a Maxwellian unperturbed distribution function, computed by linear GYRO (open squares), and linear GS2 (full circles). The codes are found in perfect agreement. The same quantities computed by GS2 in the case of an equilibrium slowing down distribution function are also plotted for comparison (full squares). For the particle thermodiffusion coefficient \(C_{T\alpha}\) as well as for the diagonal heat conduction coefficient \(\chi_{T\alpha}/\chi_{n\alpha}\) both the actual curve obtained with a Maxwellian distribution (dashed line), as well as the same curve but rescaled by the factor \(d {\rm ln} T_\alpha/d {\rm ln} T_e\) (solid line), have been plotted. The latter curve allows a direct comparison with the corresponding coefficients obtained in the case of a slowing down distribution function.
Compressional Electromagnetic Perturbations (2010)
Recently, compressional electromagnetic capability, \(\delta B_\lVert\) was added to GYRO and linear benchmarks were carried out against GS2 – the only other nonlinear code with the same capability:
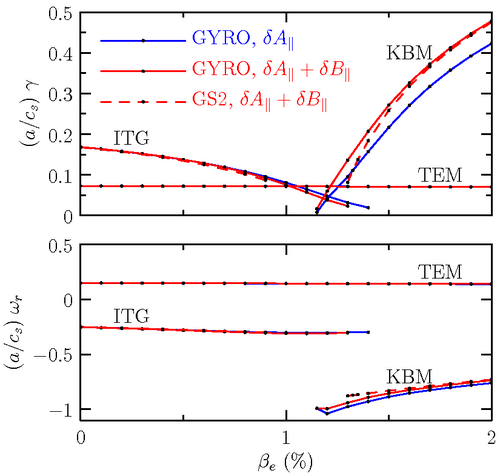
Figure 6: GYRO (solid red) versus GS2 (dashed red). GYRO results without the compressional terms are shown in blue.
GYRO Validation Abstracts
Comparison of GYRO synthetic diagnostic results with DIII-D BES and CER data
Contact – C. Holland
Abstract – The implementation of synthetic diagnostics that model physical beam emission spectroscopy and correlation electron cyclotron emission diagnostics is presented. Initial results from their applications to local gyrokinetic simulations of two locations in a DIII-D L-mode discharge performed with the GYRO code are also discussed. At both locations, the attenuation of the GYRO-predicted fluctuations due to the spatial averaging imposed by the diagnostics’ spot sizes is significant, and its incorporation via the use of synthetic diagnostics is shown to be essential for quantitative comparisons such as these.
Successes – At normalized toroidal flux \(\rho=0.5\), very good agreement was found between experiment and simulation in both the energy flows and fluctuation levels measured by both diagnostics. At both locations good agreement was found in the shapes of the radial and vertical density correlation functions and in the shapes of the frequency power spectra.
Anomalies – However, at \(\rho=0.75\), GYRO underpredicts the observed energy flows by roughly a factor of 7, with RMS fluctuation levels underpredicted by a factor of 3.
Resources – Phys. Plasmas, May 2009
Comparison of GYRO synthetic diagnostic results with C-Mod PCI data
Contact – L. Lin
Abstract – Data is taken from ohmic plasmas in the Alcator C-Mod tokamak using phase contrast imaging (PCI) diagnostic, with experiments carried out over the range of densities covering the ‘neo-Alcator’ to the ‘saturated ohmic’ regime. This was compared with GYRO simulations using a synthetic PCI diagnostic method.
Successes – The key role played by the ion temperature gradient (ITG) turbulence has been verified, including measurements of turbulent wave propagation in the ion diamagnetic direction. It is found that the intensity of density fluctuations increases with density, in agreement between simulation and experiments. The absolute fluctuation intensity agrees with the simulation within experimental error (±60%). In the saturated ohmic regime, the simulated ion and electron thermal diffusivities also agree with experiments after varying the ion temperature gradient within experimental uncertainty.
Anomalies – In the linear ohmic regime, GYRO does not agree well with experiments, showing significantly larger ion thermal transport and smaller electron thermal transport
Resources – Plasma Phys. Control. Fus., June 2009
Comparison of GYRO simulations with fast-sweeping and Doppler reflectometer data in Tore Supra
Contact – A. Casati
Abstract – Turbulence measurements in TORE SUPRA tokamak plasmas have been quantitatively compared to predictions by nonlinear gyrokinetic simulations. The GYRO results simultaneously match within experimental uncertainty (a) the magnitude of effective heat diffusivity, (b) rms values of density fluctuations, and (c) wave-number spectra in both the directions perpendicular to the magnetic field. Moreover, the GYRO nonlinear simulations help to revise as an instrumental effect the apparent experimental evidence of strong turbulence anisotropy at spatial scales of the order of ion-sound Larmor radius.
Successes – The GYRO simulations quantitatively reproduce complementary measurements from an ohmic TORE SUPRA discharge, namely heat \(\chi_\mathrm{eff}\), RMS \(\delta n/n\), \(k_\theta\), and \(k_r\) density fluctuation spectra at normalized toroidal flux \(0.5 \le\rho\le 0.7\). Good agreement is found for both the magnitude of the transport level and the shape of the density fluctuation spectra measured by fast-sweeping and Doppler reflectometers.
Anomalies – At \(\rho=0.4\), the local GYRO simulation finds conditions of marginal turbulence, underestimating the observed transport level by a factor of 3.
Resources – Phys. Rev. Lett., February 2009
Anomalous Transport in the DIII-D Tokamak Matched by Supercomputer Simulation
Contact – J. Candy
Abstract – The measured transport levels and apparent Bohm-like scaling observed in the DIII-D tokamak was reproduced with in experimental error bars using a series a GYRO simulations and sensitivity studies.
Successes – For nominal experimental paramaters, the electron transport is closely matched while the ion transport is overestimated by about a factor of 2. Decreasing gradient within error bars brings both into rough agreement.
Anomalies – There is a robust relative underestimate of electron transport.
Resources – Phys. Rev. Lett., July 2003